


What’s Happening at AIIM

A Virtual Event on “Celebrating the Women in Infrastructure Sector”
METANOIA Inauguration Ceremony
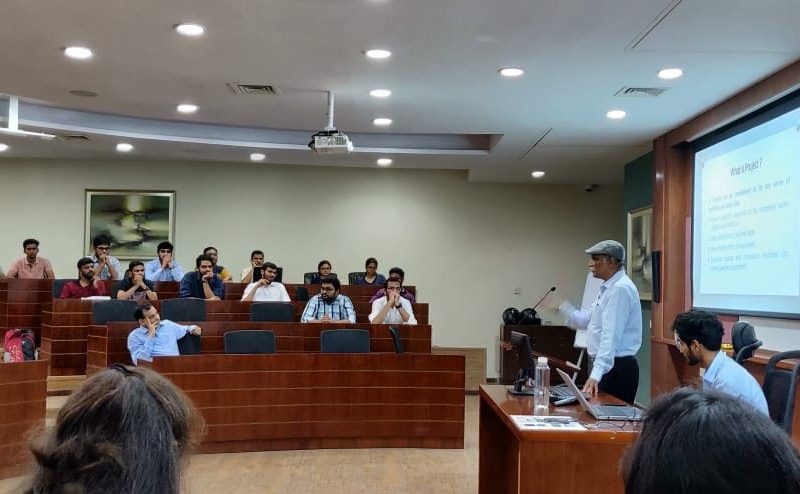
Expert talk on Project Management Consultant by Mr. Ashish Mistry
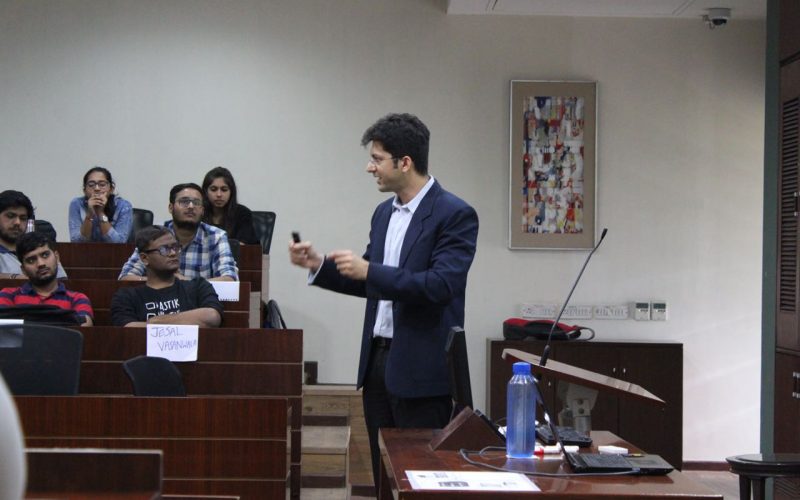
Guest Lecture by Mr. Vivek Gilani
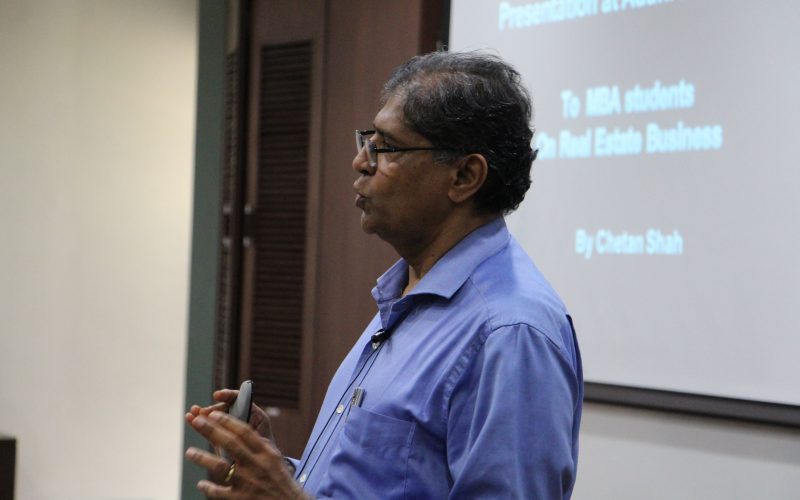
Expert talk on Real Estate Business Development and Challenges by Mr. Chetan Shah
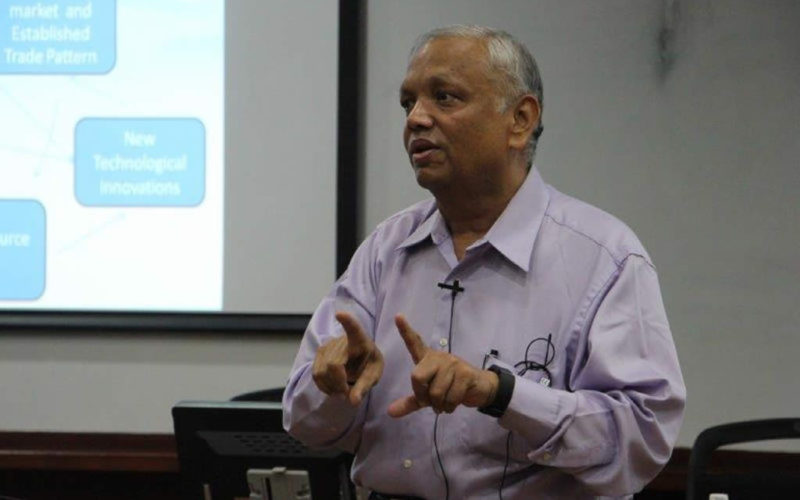
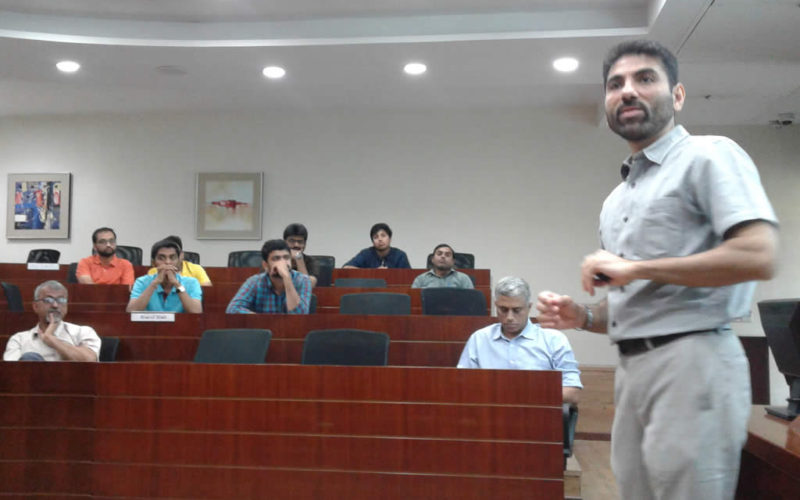
Guest Lecture by Mr Mukesh Parikh
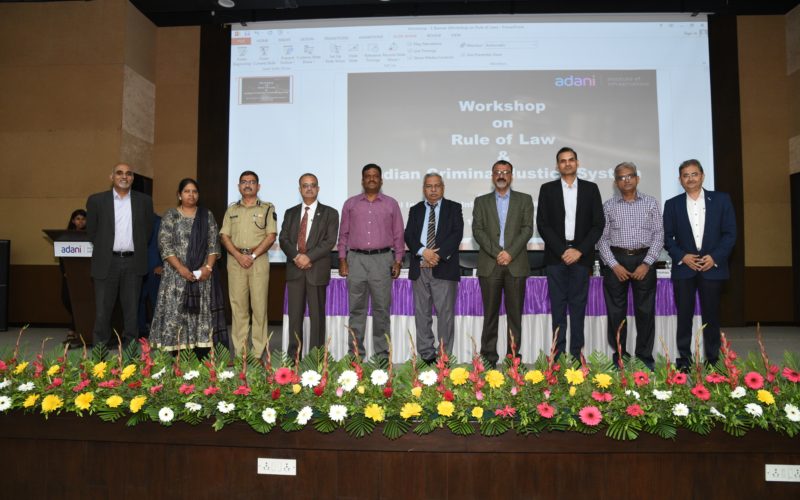
Workshop on Rule of Law & Indian Criminal Justice System
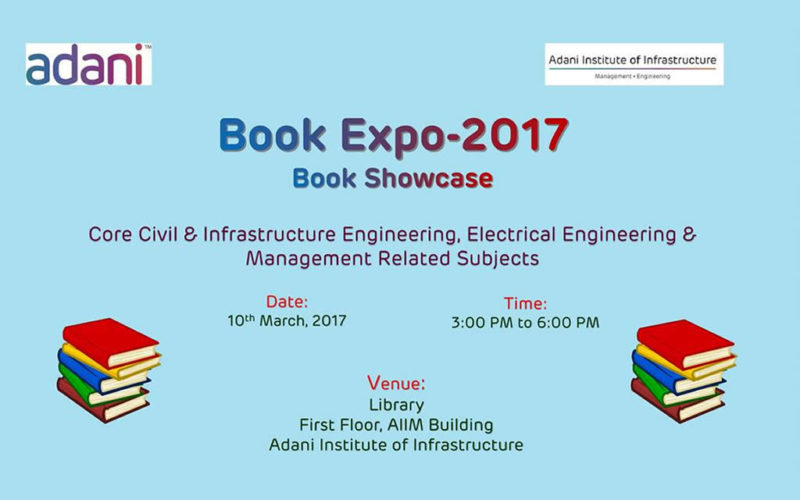
Book Expo -2017 Book Showcase
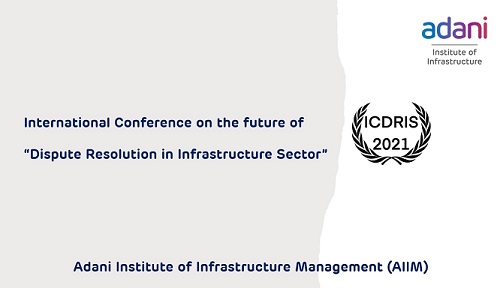
Future of Dispute Resolution in Infrastructure Sector (ICDRIS – 2021)
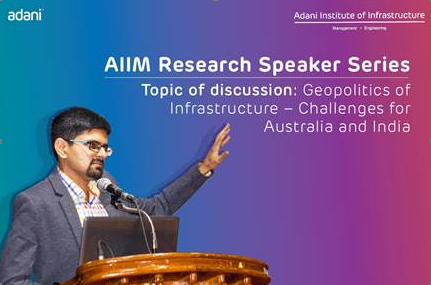
AIIM Research Speaker Series

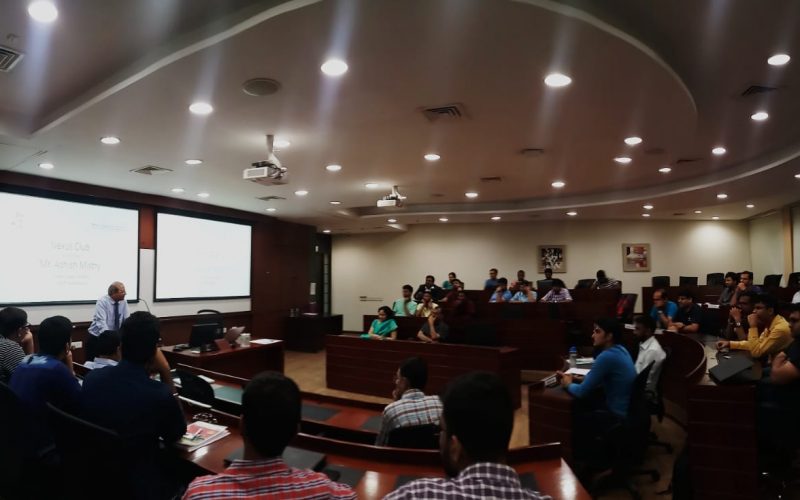
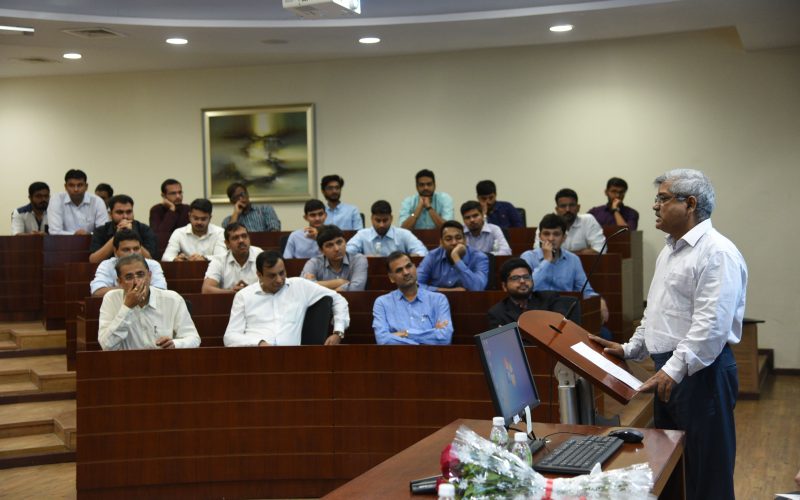
Session by Mr. Angshu Mallick - COO, Adani Wilmar
Project Management Session by Mr. Jatinder Bhatnagar, President and COO (Thermal division)
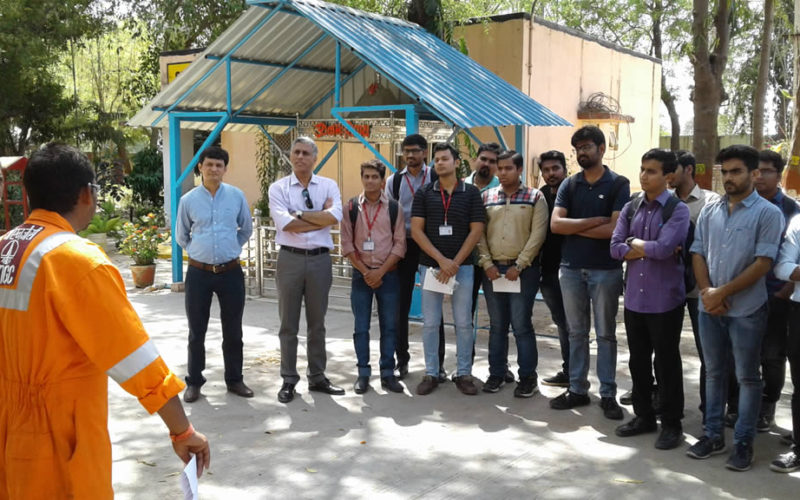
Study Visit for PGDM Students to ONGC Kalol
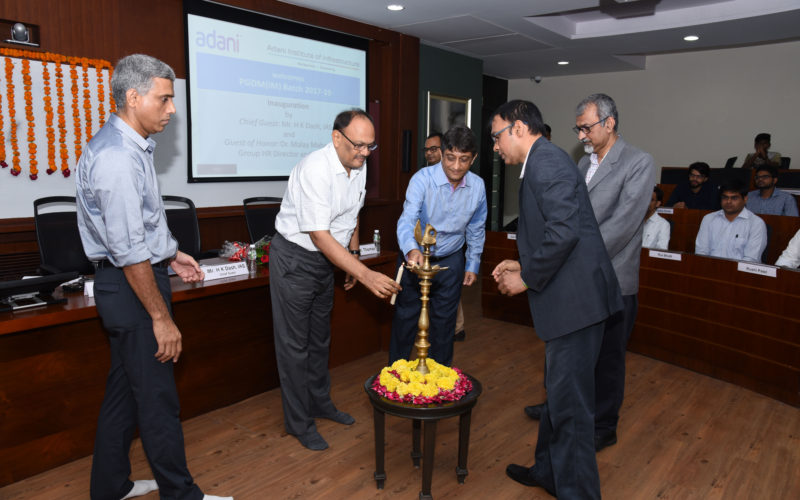
Inaugural Function for PGDM (IM) Batch 2018-20
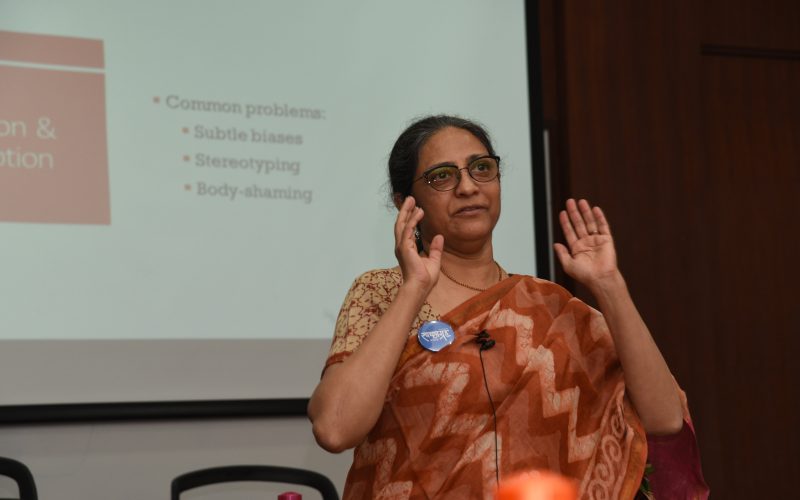
Expert Talk on Are we communicating right? by Ms. Sushama Oza
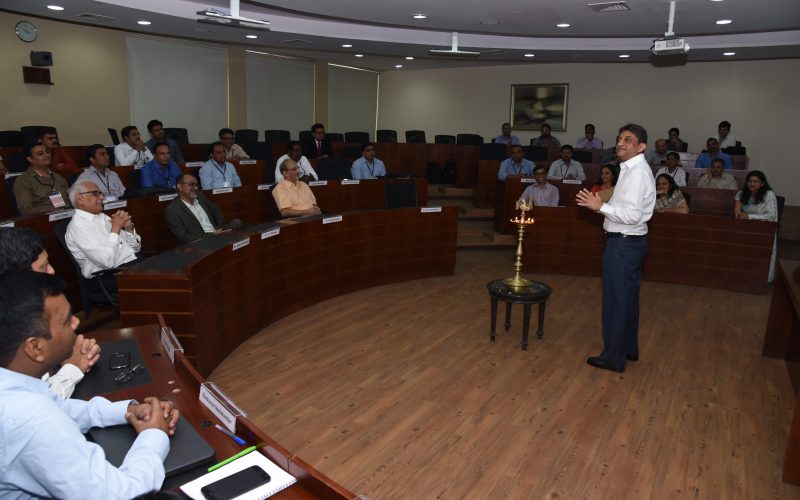
AIIM Management Development Program Inauguration Ceremony
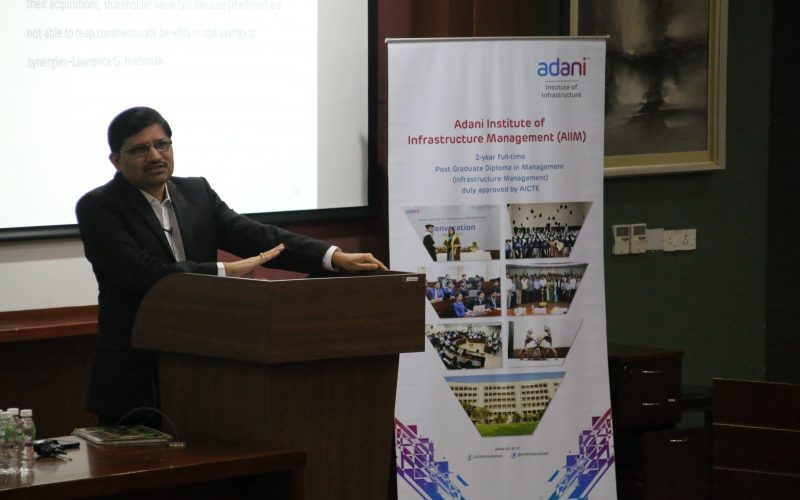
Expert Talk on Gains and Pains of Mergers and Acquisitions by Mr. Nitin Parekh
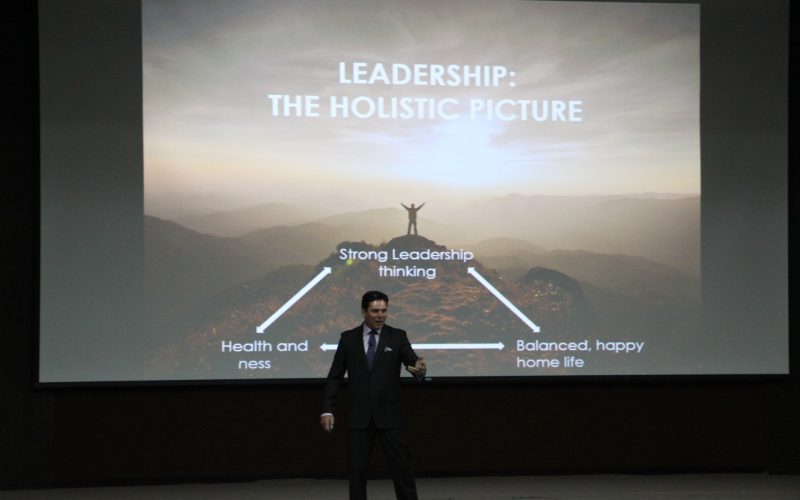
Leadership Development Program by Global Leadership Coach, Mr. Peter Cox
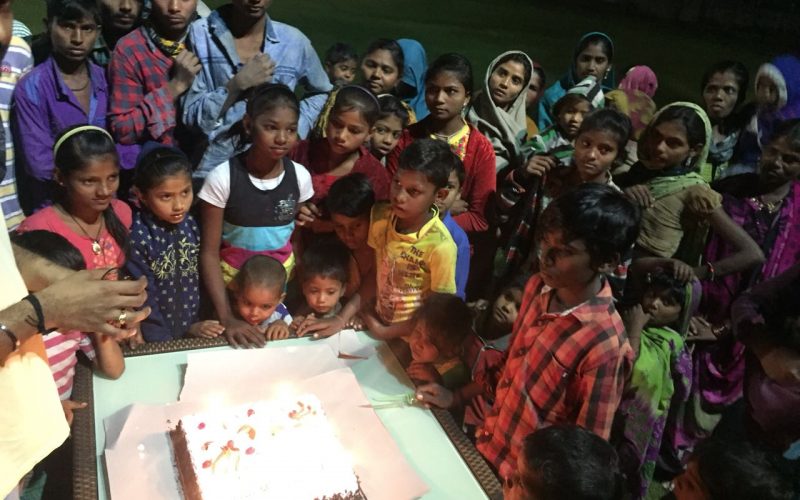
Children's Day @ Campus
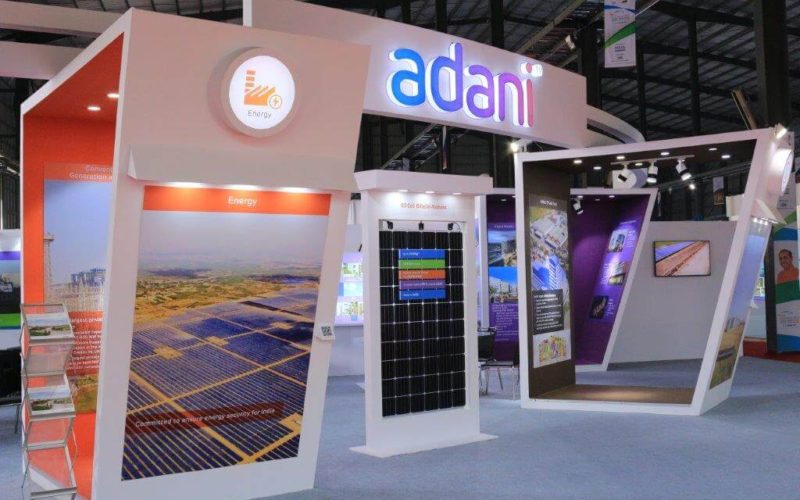
Vibrant Gujarat 2017: January 10-13, 2017
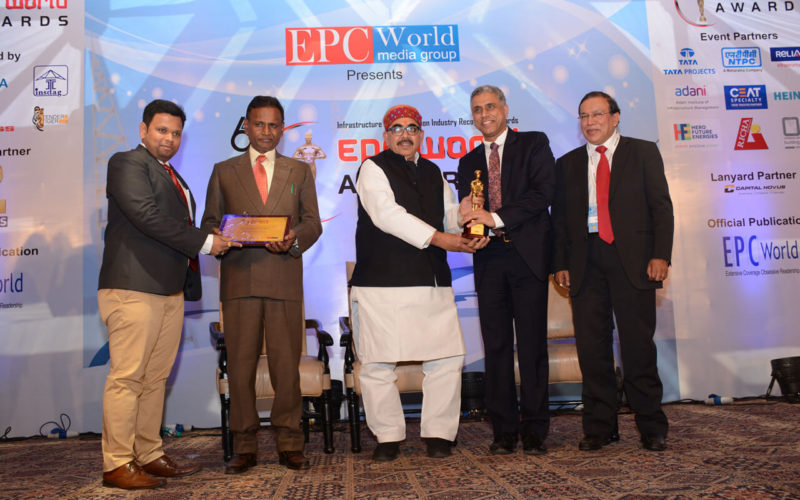
6th EPC World Awards
Logistics Asia Conference
A talk by Mr. Jay Vasavada
Smart Infrastructure Industry Confluence
Confederation of Indian Industry

Prof. Bala V. Balachandran
Mr. Bala K. Subramaniam
Role & Challenges of TPO in Institute Building
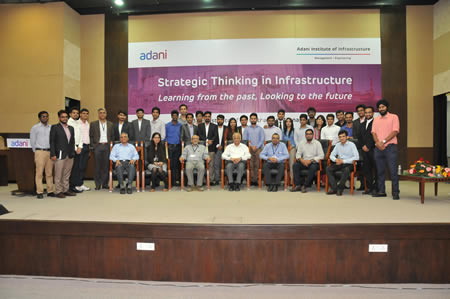
Strategic thinking in Infrastructure Sector

Knowledge Partnership with CII
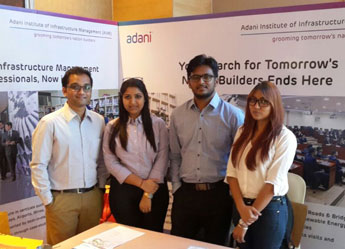
Opening Doors for 3rd Batch of Nation Builders
Power BI
POWER BI
(From Data to Dashboard)
Adani University Centre for Continuing Education (AU-CCE) is offering a hands-on virtual programme on POWER BI spread over a month.Starting from March 30 to May 05, 2023
Every Thursdays and Fridays | 04.00 to 06.00 p.m.
Data, Data Visualization, and Tools

Data visualization tools are software applications that render information in a visual format such as a graph, chart, or heat map for data analysis purposes. Business Intelligence (BI) provides actionable insights and helps a business make tactical decisions for improving the customer base and generating more value and profits.
For data visualization and business intelligence, we have several tools available in market like Power BI, Tableau, Qlik Sense, Zoho Analytics, and many more. In this programme, we shall cover the modules of the most popular tool – Microsoft Power BI.
Power BI
Microsoft Power BI is a collection of tools, software, and services that enables a business to analyze complex information and convert it into visual insights. With the help of the right tools and technologies like Microsoft Power BI, businesses can predict market behavior and make profitable decisions.
Power BI gives reporting and analytical power to a business by providing competitive information to planners and decision-makers. With Power BI, the decision-makers can source, alter, and visualize the data using Artificial Intelligence and make better decisions based on the scenarios.
So, let’s dive deep into in the ocean of ‘Microsoft Power BI’ and take one step further in enhancing their career.
Objective of the programme
- Connect and transform data for analysis and decision making
- Model and analyze data to gain a deeper business understanding
- Data analysis for enhancing business productivity and profitability
- Insights on data visualization
- Data‐based decision‐making based on the accuracy
Programme Module and Key Learnings
- Introduction to Power BI
- Power BI Portfolio
- Introduction to Power BI Desktop
- Integration of Data from various sources
- Data Sources in Power BI Desktop
- Types of data source connectors available
- Connecting to multiple data sources
- Data Cleansing and Transformations
- Clean and shape your data with Query Editor
- Combining Data – Merging and Appending
- Cleaning irregularly formatted data
- Introduction to Advanced Editor M query
- Various types of transformations and features for data cleansing
- Creation of Data Models
- Introduction to Data Modelling
- Setup and Manage Relationships
- Cardinality and Cross Filtering
- DAX measures and columns for creating relationships
- Different types of visualizations (Bar, line,Scatter & Bubble Charts & Play Axis, and more)
- Analysis of Geospatial data
- Slicers, Timeline Slicers & Sync Slicers
- Cross Filtering and Highlighting
- Power BI Desktop Visualizations
- Multivariate reporting and analysis using Power BI custom visuals and advanced features
- Drill Down and drill through between tabs
- Conditional Formatting in visuals and tables
- Using KPIs, Cards & Gauges
- Report page tooltips for deeper analysis
- Drill through between reports
- DAX calculations for time series calculations, Excel‐based functions
- Power BI Service & creation of dashboards
- Creation of dashboards
- Sharing of dashboards and reports
- Getting quick insights from your data
- Setting up email alerts on dashboards
- Creating Power BI reports from your own Excel data
- Connecting multiple Excel files and creating appropriate relationships between them
- Shaping and cleaning the data in Query Editor
- Data Exploration and visualization of required KPIs
Engagement Model
- Live sessions
- Audio/Video
- Hands-on practice
- Illustrations
- Assignments

At the end of the programme
- You shall be able to create attractive dashboards using your own data
- Present the data visually with infographics and merge the multiple sheets into one dashboard
- You shall be able to analyze the data and create action‐induced response
- Enhance your career as Data Analyst, Data scientist, and many other key positions with senior management
Who Should Attend
- Mid‐level to senior managers from different functions of management.
- Businessmen, entrepreneurs, and aspiring start-up owners
- Businessmen, entrepreneurs, and aspiring start-up owners
Facilitators

Prof. Amit is Co-founder and Chief Product Officer at Metis Intellisystems Pvt. Ltd.

Dr. Iyyappan is an Assistant Professor in the Department of CSE & ICT, at Adani University.
Investment
Rs.15,999/‐
Fee includes programme fee, digital reading material and certificate of completion. Certificate shall be issued based on minimum 80% attendance, evaluation tests and submission of assignments. (Taxes extra applicable)
Special concession of 25% for group nominations and students.
For more details, please contact:
Centre for Continuing Education
Adani University
Adani Shantigram Township, Near Vaishnodevi Circle,
Adani Shantigram Township, Near Vaishnodevi Circle,
Mobile: 9824006083 / 7859968342
Landline: 2555-4910 / 2555-4910
Email: cce@adaniuni.ac.in